ES0.4 Key Metrics: MTTD, MTTR, and What Actually Matters
Figure ES0.4 — Vanity metrics measure activity and look good on dashboards. Engineering metrics measure whether the endpoint security stack actually prevents, detects, and contains attacks. Both have a place — but only engineering metrics drive configuration decisions.
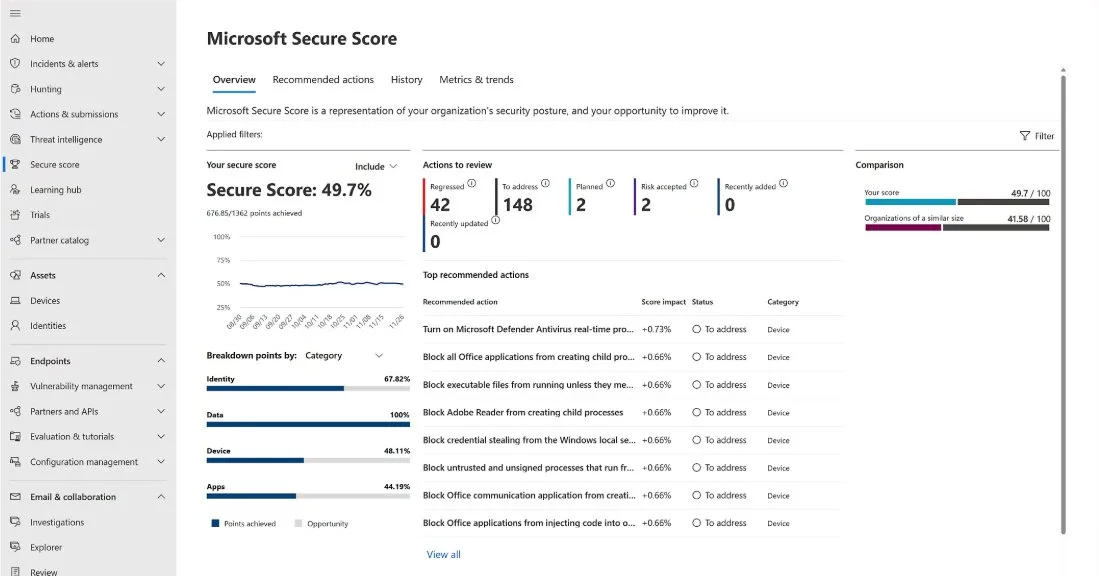
Figure ES0.4a — Microsoft Secure Score provides a posture assessment across Identity (67.82%), Data (100%), Device (48.11%), and Apps (44.19%). The top recommended actions are endpoint security controls: ASR rules (block Office child processes, block credential stealing from LSASS, block unsigned processes) and AV real-time protection. A Device score of 48% indicates that over half of available endpoint security controls are not yet deployed — the gap this course closes.
Why MTTD and MTTR are necessary but insufficient
Mean Time to Detect (MTTD) and Mean Time to Respond (MTTR) are the most commonly reported SOC metrics. They appear in every vendor pitch, every analyst report, and every board-level security presentation. They matter because they measure speed — and speed matters during an active incident. A SOC that detects an AiTM attack in 8 minutes and contains it in 15 minutes produces a fundamentally different outcome than one that takes 4 hours for each.
The problem is that MTTD and MTTR can be optimized without improving security. Auto-closing low-severity alerts reduces MTTR to near zero for those alerts — but the alerts are closed, not investigated. Detecting only commodity threats (for which MDE has built-in detections) produces a fast MTTD for those threats — but says nothing about detection capability for targeted attacks. A SOC that handles 95% of alerts in under 10 minutes but misses the 5% that represent actual compromise has excellent MTTD/MTTR numbers and a catastrophic security posture.
The metrics that drive endpoint security engineering decisions are different. They measure what the stack actually prevents, what it actually detects, and what coverage gaps remain.
The metrics that drive endpoint security engineering
Prevention metrics measure whether your prevention controls are configured and effective:
The percentage of ASR rules in block mode across the fleet tells you how much of the prevention layer is actually preventing. If 3 of 18 ASR rules are in block mode on 60% of devices, your prevention coverage is approximately 10% of its potential. The target is not 100% of rules in block mode — some rules have legitimate business conflicts that keep them in audit or warn mode permanently. But the metric tracks progress.
AV cloud protection level across the fleet reveals how many devices are operating with enhanced protection. Default level is functional. High+ catches significantly more unknown threats. The metric shows you the gap between what your license provides and what your configuration delivers.
Detection metrics measure whether your detection layer finds real threats:
The total custom detection rule count matters because zero custom rules means you depend entirely on Microsoft’s built-in detections. Built-in detections are good for commodity threats but do not cover your organisation’s specific patterns, your environment’s normal baselines, or the targeted techniques that your threat model identifies as highest risk.
The hunting cadence — how frequently analysts execute proactive hunting queries — measures whether the detection layer extends beyond automated rules. A SOC that hunts weekly finds threats that scheduled rules miss because the hunt can adapt to emerging intelligence in real time.
Forensic readiness metrics measure whether evidence will exist when needed:
The percentage of endpoints with advanced audit policies, PowerShell ScriptBlock logging, and Sysmon configured tells you whether your IR team can reconstruct attacker actions after containment. This metric is binary for each endpoint — either the logging is configured or it is not. Partial logging (audit policy configured but PowerShell logging missing) creates evidence gaps.
Your CISO wants a single metric for the monthly board report that represents overall endpoint security posture. You have two options: (A) composite MTTD/MTTR across all alert severities, or (B) MDE’s exposure score combined with ASR enforcement percentage. Option B is more honest. The exposure score measures actual attack surface — it accounts for unpatched vulnerabilities, missing configurations, and risky devices. The ASR enforcement percentage measures how much of the prevention layer is active. Together, they answer the board’s real question: “how protected are we?” MTTD/MTTR answers a different question: “how fast do we react when something happens?” Both matter. But the board wants to know about protection, not reaction speed. Present MTTD/MTTR as a secondary metric alongside the exposure score as the primary indicator.
Try it: query your current endpoint security metrics
Run these KQL queries in Advanced Hunting (security.microsoft.com → Hunting → Advanced hunting) to measure your current state:
ASR enforcement status across the fleet:
| |
Custom detection rule effectiveness (last 30 days):
| |
Device health and onboarding coverage:
| |
These three queries give you the starting metrics for your endpoint security engineering effort. Record the results — you will compare them against your targets as you progress through this course.
The myth: Auditors require specific MTTD and MTTR numbers. We need to get MTTD under 15 minutes and MTTR under 1 hour to satisfy the compliance requirement.
The reality: No major compliance framework specifies MTTD or MTTR thresholds. PCI DSS requires that security incidents are “identified and responded to in a timely manner” (Requirement 12.10.5) — “timely” is context-dependent, not a specific number. ISO 27001 A.5.25 requires that information security incidents are “responded to in accordance with the documented procedures” — it measures process existence, not response speed. NIST CSF requires “timely detection of cybersecurity events” — again, no specific threshold. The specific MTTD/MTTR numbers in vendor presentations are industry benchmarks for comparison purposes, not compliance requirements. What auditors actually verify: do you have incident response procedures? Are they followed? Is there evidence of detection and response? Can you demonstrate the process worked? Focus on building the detection and response capability. The metrics will follow.
Troubleshooting
“Our CISO only cares about MTTD/MTTR — they do not want to hear about ASR enforcement percentages.” Present both. Lead with the metric the CISO cares about (MTTD/MTTR), then show the metric that explains it. “Our MTTR improved by 15% this quarter because we moved 6 ASR rules from audit to block mode, preventing 340 incidents that would have required analyst response.” The CISO gets the number they want. You get the engineering investment you need. The ASR enforcement metric explains the MTTR improvement, creating a clear cause-and-effect narrative that justifies continued investment.
“We do not have enough data to calculate meaningful metrics — we only have 3 months of MDE telemetry.” Three months is sufficient for most endpoint security metrics. ASR audit data stabilises within 2-4 weeks (you can identify false positive patterns and make enforcement decisions). Device health metrics are real-time. Exposure score is calculated daily. The only metric that benefits from longer data is hunting effectiveness, which requires baseline establishment. Start measuring now with whatever data you have. The trend matters more than the absolute number.
“Our managed SOC provides metrics in their monthly report — why do we need our own?” Because your MSSP’s metrics measure their performance, not your security posture. MSSP reports show: alerts handled, mean response time, incidents escalated. They do not show: ASR enforcement coverage, custom detection rule TP rate, technique coverage gaps, forensic readiness completeness. You need both sets of metrics — the MSSP’s operational metrics and your own engineering metrics — to have a complete picture.
Building the measurement cadence
Metrics without cadence are snapshots that never become trends. The measurement cadence for NE’s endpoint security program:
Daily (automated): Device health summary query (ES2.8) — total devices, active sensors, inactive sensors. AV health query — devices with stale signatures. These run as saved queries or Sentinel automation rules and alert on threshold violations. No analyst time required unless an alert fires.
Weekly (15 minutes): ASR enforcement summary — how many rules are in block mode across the fleet, how many block events occurred this week (by rule). Hunting cadence check — were the weekly hunting queries executed? Any findings? This is a quick status check during the security team standup, not a deep analysis.
Monthly (2 hours): Custom detection performance review — for each active custom detection rule, calculate the TP rate over the last 30 days. Rules below 30% TP rate are flagged for tuning. Rules above 80% TP rate are candidates for automated response actions. Exposure score trend — is the score improving (hardening efforts reducing attack surface) or degrading (new vulnerabilities being introduced faster than remediation)? Generate the executive dashboard for the CISO’s monthly report.
Quarterly (half day): ATT&CK technique coverage mapping — which techniques in the threat model are covered by detections (built-in + custom)? Which gaps remain? This drives the detection engineering backlog for the next quarter. Maturity model re-assessment — score each layer of the architecture against the maturity model from ES0.9. Compare to the previous quarter’s scores. The delta is the progress metric that justifies continued investment.
The cadence ensures metrics are not a one-time assessment but a continuous measurement system that tracks improvement and catches degradation before it becomes a security incident.
You're reading the free modules of this course
The full course continues with advanced topics, production detection rules, worked investigation scenarios, and deployable artifacts. Premium subscribers get access to all courses.